 Subscribe
 Follow Us
Great Highcharts with jQuery
 12 years ago
 16481
16481 2760
2760
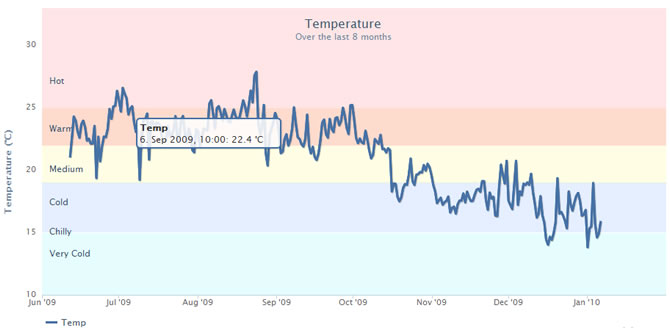
There are some great JavaScript graph libraries out there and one that’s recently come to my attention is Highcharts.com which is compatible with both the jQuery and Mootools frameworks. To get started point your browser here where you can download all the files you need including examples. Highcharts features include slick tooltips to reference points on your charts, it’s compatible with all standard web browsers, the setup for a graph as demonstrated below is simple and uses the JSON data type, there are also multiple types of graph type, from line, spline, area, areaspline, column, bar, pie and scatter chart.
Here’s how to setup a simple chart. you need to include the jQuery framework as well as the highcharts.js file and excanvas.js file for IE users which you’ll get in the download from Highcharts. once you’ve got that setup simply paste this into your document head, and create a div with the id ‘graphDiv’, this is where the graph will render to. Note in the first few lines of setup code at the top of the script we specify this along with the chart type. In this case we’re using a bar chart. Below that we have the setup title parameter which is the main label for the graph along with the labels for the x and y axis.
$(document).ready(function() {
   var chart1 = new Highcharts.Chart({
      chart: {
         renderTo: 'graphDiv',
         defaultSeriesType: 'bar'
      },
      title: {
         text: 'Fruit Consumption'
      },
      xAxis: {
         categories: ['Apples', 'Bananas', 'Oranges']
      },
      yAxis: {
         title: {
            text: 'Fruit eaten'
         }
      },
      series: [{
         name: 'Anne',
         data: [1, 0, 4]
      }, {
         name: 'Martin',
         data: [5, 7, 3]
      }]
   });
});
The article source:http://papermashup.com/using-highcharts-javascript-library/
Tags
accordion accordion menu animation navigation animation navigation menu carousel checkbox inputs css3 css3 menu css3 navigation date picker dialog drag drop drop down menu drop down navigation menu elastic navigation form form validation gallery glide navigation horizontal navigation menu hover effect image gallery image hover image lightbox image scroller image slideshow multi-level navigation menus rating select dependent select list slide image slider menu stylish form table tabs text effect text scroller tooltips tree menu vertical navigation menu