 Subscribe
 Follow Us
Line Graph Effect With Css Only
 13 years ago
 12236
12236 2917
2917
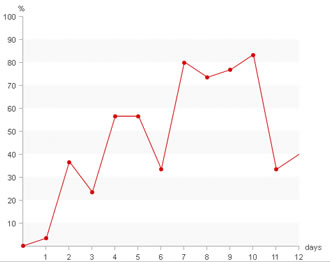
the line graphs. What are they good for? I will mention just one reason, and leave other advantages or downsides for a debate: users scan your page, they don't read every word and number you write. Line graphs will deliver information much faster then a table filled with numbers.
If you look at the css file I created 4 groups of class names: 2 for setting starting position and 2 for defining the "move".
I divided starting position class name groups based on the situation where we are increasing values (using line-up, the upper part of the image) or decreasing values (lower part of the image).
I named those class names .pi1 or .pd1 ("p"osition "i"ncreasing 1) or ("p"osition "d"ecreasing 1) By looking at the css file you'll notice that .pi group has negative top values which shits sprite image up while .pd group has positive top values (shifts image down).
Actual line movements are defined with class names like .i1 or .d1 i.e. this class name .i24 increases the value by 24 points.
Choosing a proper position (".p" class) is fairly easy: you have to take a look at previous item which can be something like:
<dd><span class="pi1 i10"><em>33</em></span></dd>
We have pi1 and i10. It means that we have item starting at point 1 and is increased by 10 points. That makes point 11 our new starting point. If our next move is increase we are choosing .pi11 but if we're decreasing we choose .pd11!
If this sound to complex (or if I presented it poorly) just remember that when choosing both class name you have to be careful that you don't mix i's and d's
This is good:
<dd><span class="pi1 i10"><em>33</em></span></dd>
and this isn't
<dd><span class="pi1 d10"><em>33</em></span></dd>
Now, let me explain what's with the EM element. Items are placed next to each other without overlapping so the line connections are not smooth. I am using EMs to place dots over these connecting points to cover them. EMs are absolutely positioned to cover the PREVIOUS line connection area. There is one default css definition for EMs although the decreasing items need additional class name .d - that's why I mentioned that some of the SPANS has 3 class names. The decreasing item is marked up like this:
<dd><span class="pd10 d d1"><em>46</em></span></dd>
Please note that class names are written in "points" or "steps" not the actual values. In my case each "point" represents 3,3%
As mentioned, I am not trying to replace advanced JS or flash techniques with this. I am offering an alternative way to visualize data and perhaps different view of CSS usage. This method has it's limitations, but it's pure CSS!
You might also like
Tags
accordion accordion menu animation navigation animation navigation menu carousel checkbox inputs css3 css3 menu css3 navigation date picker dialog drag drop drop down menu drop down navigation menu elastic navigation form form validation gallery glide navigation horizontal navigation menu hover effect image gallery image hover image lightbox image scroller image slideshow multi-level navigation menus rating select dependent select list slide image slider menu stylish form table tabs text effect text scroller tooltips tree menu vertical navigation menu