 Subscribe
 Follow Us
jQuery with Google Charts
 13 years ago
 19326
19326 3494
3494
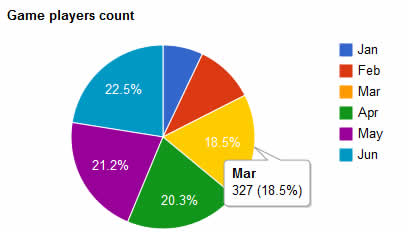
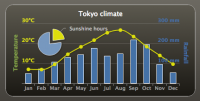
gvChart is a plugin for jQuery, that uses Google Charts to create interactive visualization by using data from the HTML table tag. It is easy in use and additionally it allows you to create five types of the charts.
Creating chart in three steps
Create HTML table
Create table with your data. The table must be well formed:
- Table should have caption element – it will be used as a title of the chart.
- Table should be divided into two parts: thead and tbody.
- In the thead element create one row with th elements. They will be used as arguments presented on the x-axis.
- In the tbody element place data rows. Each row represents one data set. The first element of the row should be th with the name of the data set.
Download gvChart
Download gvChart and place it in your HTML code.
To use this plugin you have to put script tags reffering to jQuery, gvChart and Google jsapi.
<script type="text/javascript" src="http://www.google.com/jsapi"></script>
<script type="text/javascript" src="jquery.min.js"></script>
<script type="text/javascript" src="jquery.gvChart-0.1.min.js"></script>
Important! Google jsapi script tag must be placed before gvChart script.
Before using script you have to initialize Google Api, by using gvChartInit() function. This function may not work when placed in the external JavaScript file. It is better idea to place it inline in the head.
<script type="text/javascript">
 gvChartInit();
</script>
Connect gvChart to the table
Now you can use gvChart in your scripts. Below is a basic example of usage.
jQuery('#myTable').gvChart({
 chartType: 'ColumnChart',
 gvSettings: {
  vAxis: {title: 'No of players'},
  hAxis: {title: 'Month'},
  width: 720,
  height: 300,
  }
});
gvChart settings
chartType – You can use five different google charts, by setting chartType to one of:
You might also like
Tags
accordion accordion menu animation navigation animation navigation menu carousel checkbox inputs css3 css3 menu css3 navigation date picker dialog drag drop drop down menu drop down navigation menu elastic navigation form form validation gallery glide navigation horizontal navigation menu hover effect image gallery image hover image lightbox image scroller image slideshow multi-level navigation menus rating select dependent select list slide image slider menu stylish form table tabs text effect text scroller tooltips tree menu vertical navigation menu